Update: the results below showed the EP1 plan to be a clear outlier in some of its performance results. I’ve since retested on a fresh EP1 plan and confirmed these results as accurate and been able to provide further insight into the performance: Azure Functions Performance – Update on EP1 Results – Azure From The Trenches.
I was recently asked if I would spend some time comparing AWS Lambda with Azure Functions at a meetup - of course, happily! As part of that preparing for that I did a bit of a dive into the performance aspects of the two systems and I think the results are interesting and useful and so I’m also going to share them here.
Test Methodology
Methodology may be a bit grand but here’s how I ran the tests.
The majority of the tests were conducted with SuperBenchmarker against systems deployed entirely in the UK (eu-west-2 on AWS and UK South on Azure). I interleaved the results - testing on AWS, testing on Azure, and ran the tests multiple times to ensure I was getting consistent results.
I’ve not focused on cold start as Mikhail Shilkov has covered that ground excellently and I really have nothing to add to his analysis:
Cold Starts in Azure Functions | Mikhail Shilkov
Cold Starts in AWS Lambda | Mikhail Shilkov
I essentially focused on two sets of tests - an IO workload (flushing a queue and writing some blobs) and a compute workload (calculating a mandelbrot and returning it as an image).
All tests are making use of .NET Core 3.1 and I’ve tested on the following configurations:
- Azure Functions - Consumption Plan
- Azure Functions - EP1 Premium Plan
- Azure Functions - EP2 Premium Plan
- AWS Lambda - 256 Mb
- AWS Lambda - 1024 Mb
- AWS Lambda - 2048 Mb
Its worth noting that Lambda assigns a proportion of CPU(s) based on the allocated memory - more memory means more horsepower and potentially multiple cores (beyond the 1.8Gb mark if memory serves).
Queue Processing
For this test I preloaded a queue with 10,000 and 100,000 queue items and wrote the time the queue item was processed to a blob file (a file per queue item). The measured times are between the time the first blob was created and the time the last blob was created.
On Azure I made use of Azure Queue Storage and Azure Blob Storage and on AWS I used SQS and S3.
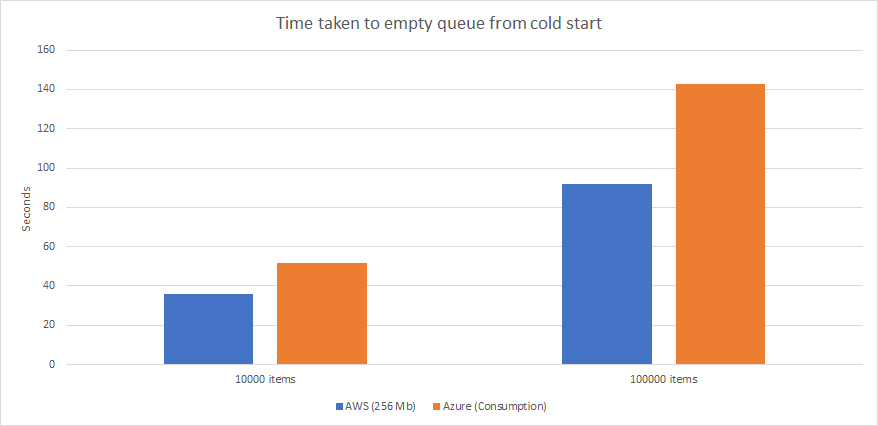
AWS was the clear winner of this test and from the shape of the data it appeared that AWS was accelerating faster than Azure - more eager to process more items but I would need to do further testing to compare. However it is possible the other services were a influencing factor. However its a reasonable IO test on common services by a function.
HTTP Trigger under steady load
This test was focused on a compute workload - essentially calculating a Mandelbrot. The Function / Lambda will generate n lambda’s based on a query parameter. The Mandelbrots are generated in parallel using the Task system.
32 concurrent requests, 1 Mandelbrot per request
Percentile and average response times can be seen in the graph below (lower is better):
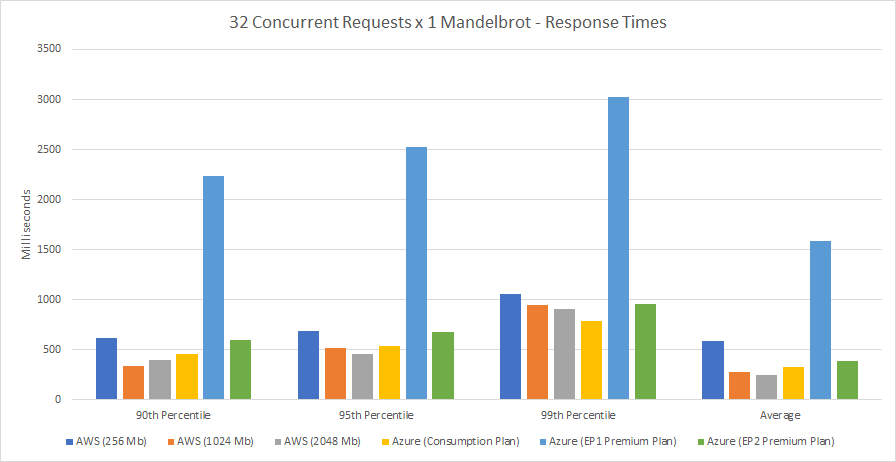
With this low level of low all the services performed acceptable. The Azure Premium Plans strangely perform the worst with the EP1 service being particularly bad. I reran this several times and received similar results.
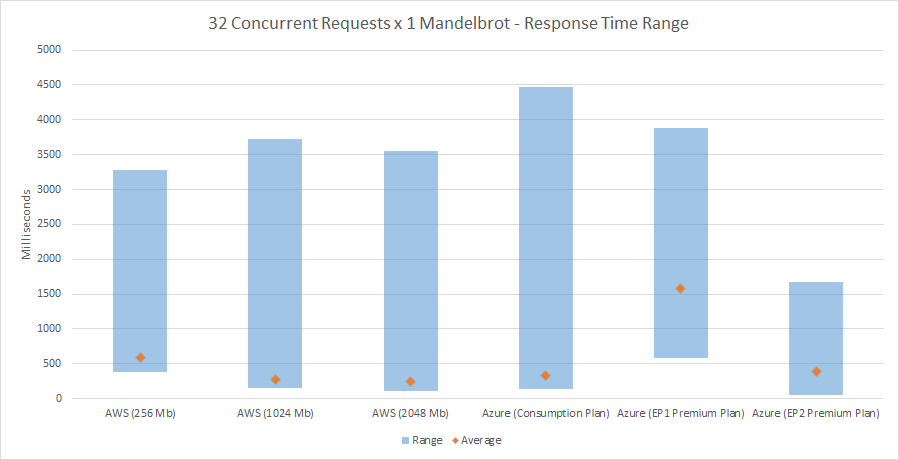
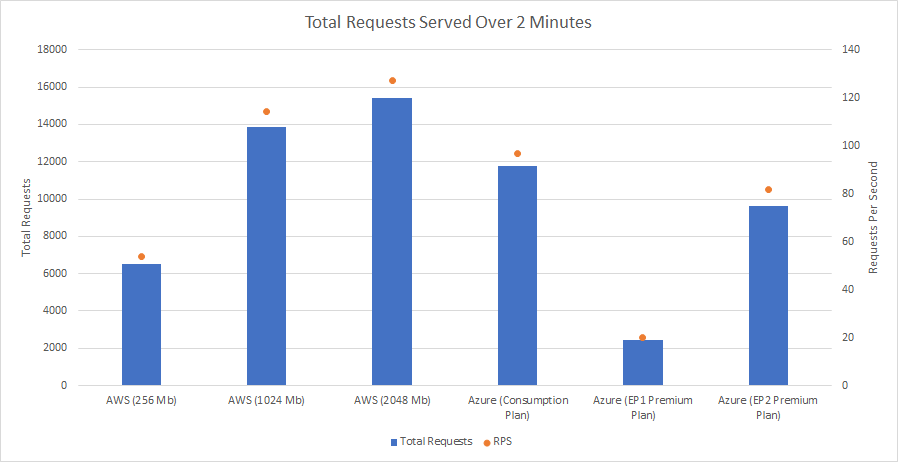
The range of response times (min, max) can be seen below alongside the average where we can see again followed by the total number of requests served over the 2 minute period:
32 concurrent requests, 8 Mandelbrots per request
In this test each request results in the Lambda / Function calculating the Mandelbrot 8 times in parallel and then returning one of the Mandelbrots as an image.
Percentile and average response times can be seen in the graph below (lower is better):
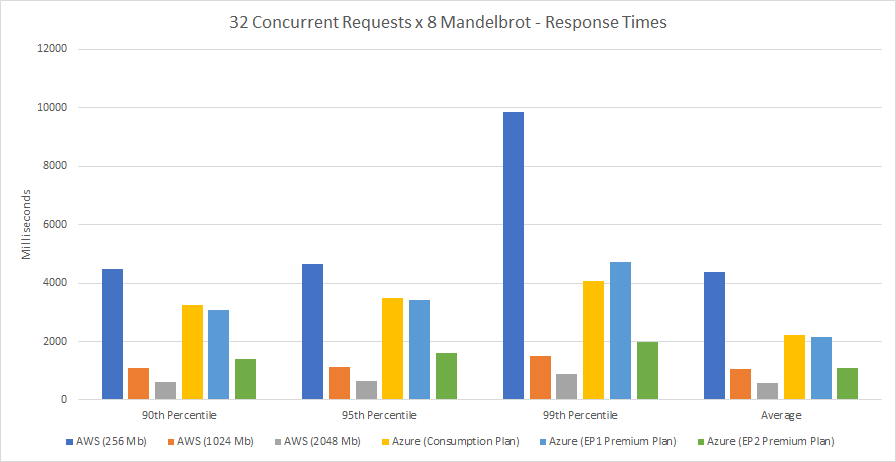
Things get a bit more interesting here. The level of compute is beyond the proportion of CPU assigned to the 256Mb Lambda and it struggles constantly. The Consumption Plan and EP1 Premium Plan fair a little better but are still impacted. However the 1024Mb and 2048Mb Lambda’s are comfortable - with the latter essentially being unchanged.
The range of response times (min, max) can be seen below alongside the average where we can see again followed by the total number of requests served over the 2 minute period:
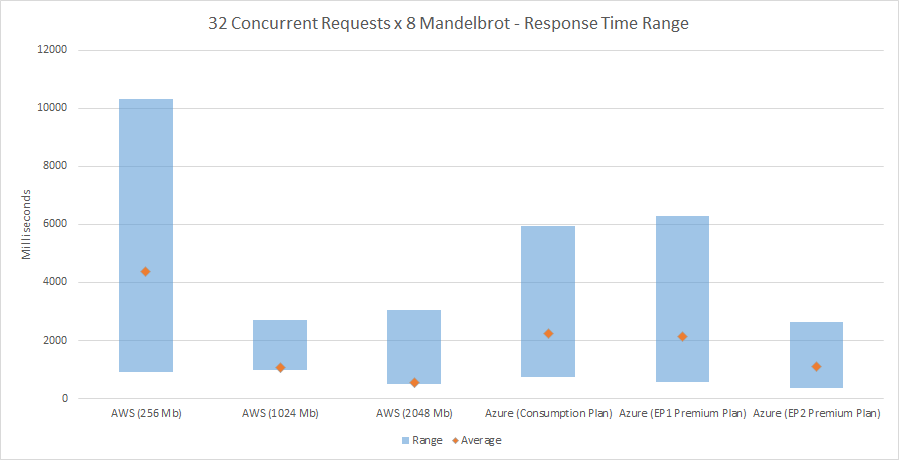
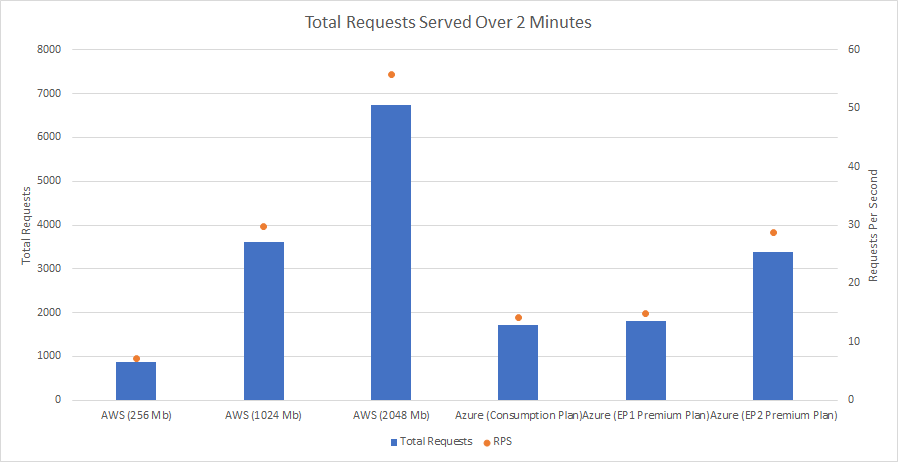
I don’t think there’s much to add here - it largely plays out as you’d expect.
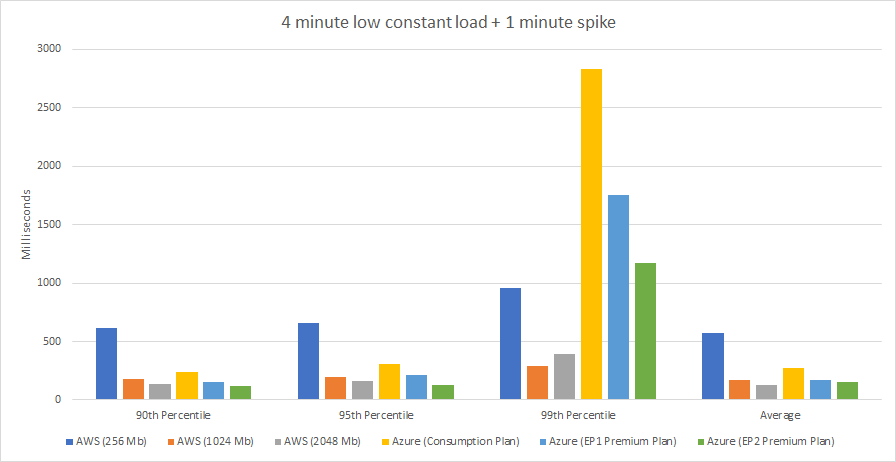
HTTP undergoing a load spike
In this test I ran at a low and steady rate of 2 concurrent requests for 1 Mandelbrot over 4 minutes. After around 1 to 2 minutes time I then loaded the system, independently, with a spike of 64 concurrent requests for 8 Mandelbrots.
Azure
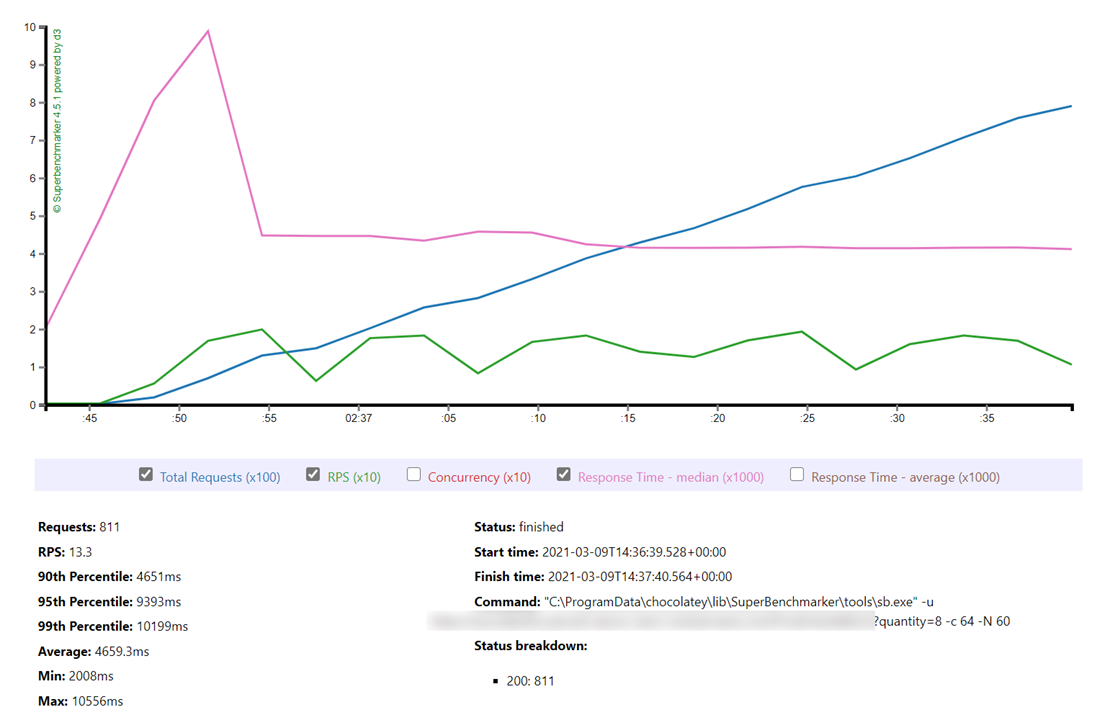
First up Azure with the Consumption Plan:
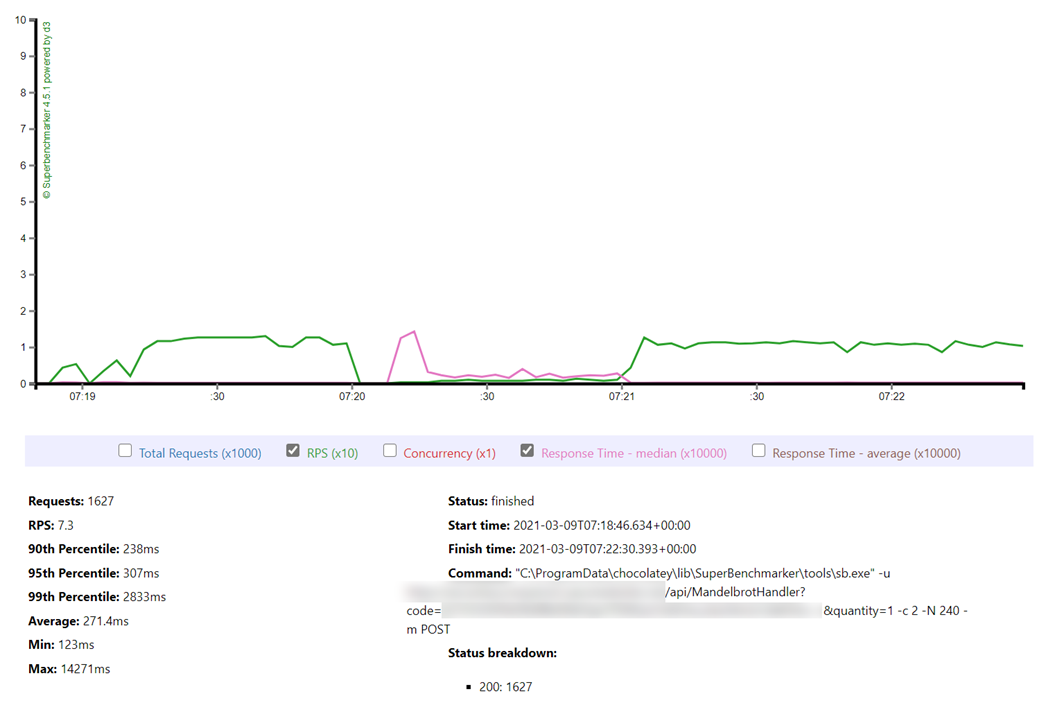
Its clear to see in this graph where the additional load begins and, unfortunately, Azure really struggles with this. Served requests largely flatline throughout the spike. To provide more insight here’s a graph of the spike (note: I actually captured this from a later run but the results were the same as this first run).
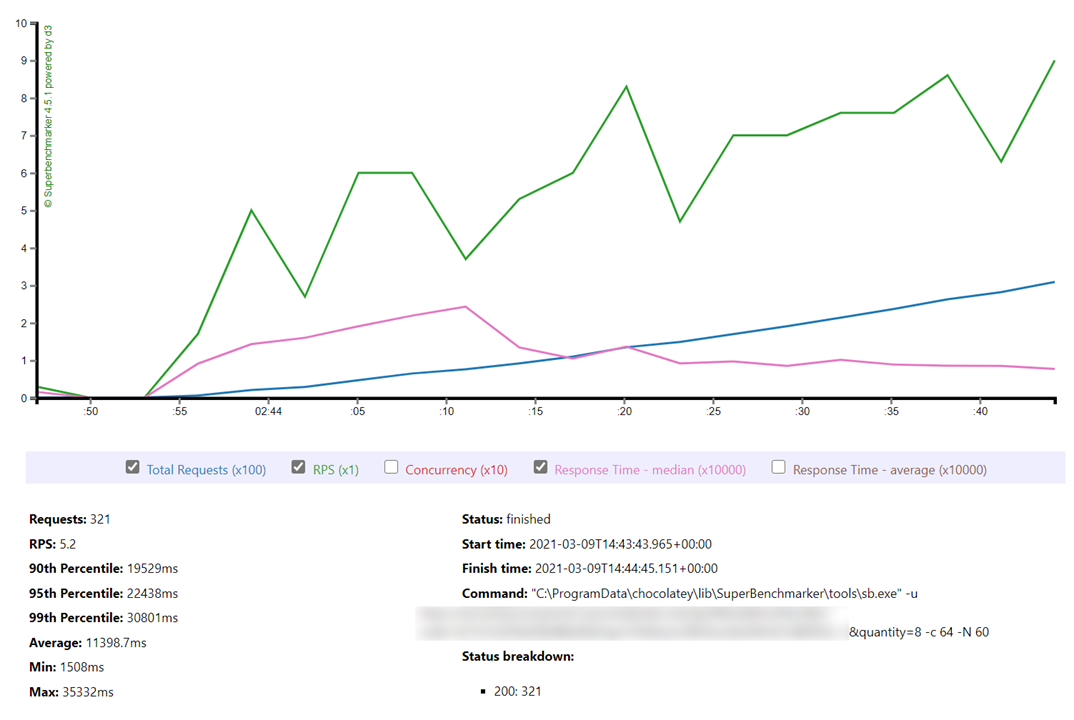
Azure struggled to serve any of this. It didn’t fail any requests but performance really has nosedived.
I captured the same data for the EP1 and EP2 Premium Plans and these can be seen below:
Unfortunately Azure continues to struggle - even on an EP2 plan (costing £250 per month at a minimum). The spike data was broadly the same as in the Consumption plan run.
I would suggest this is due to Azure’s fairly monolithic architecture - all of our functions are running in shared resource and the more expensive requests can sink the entire shared space and Azure isn’t able to address this.
Lambda
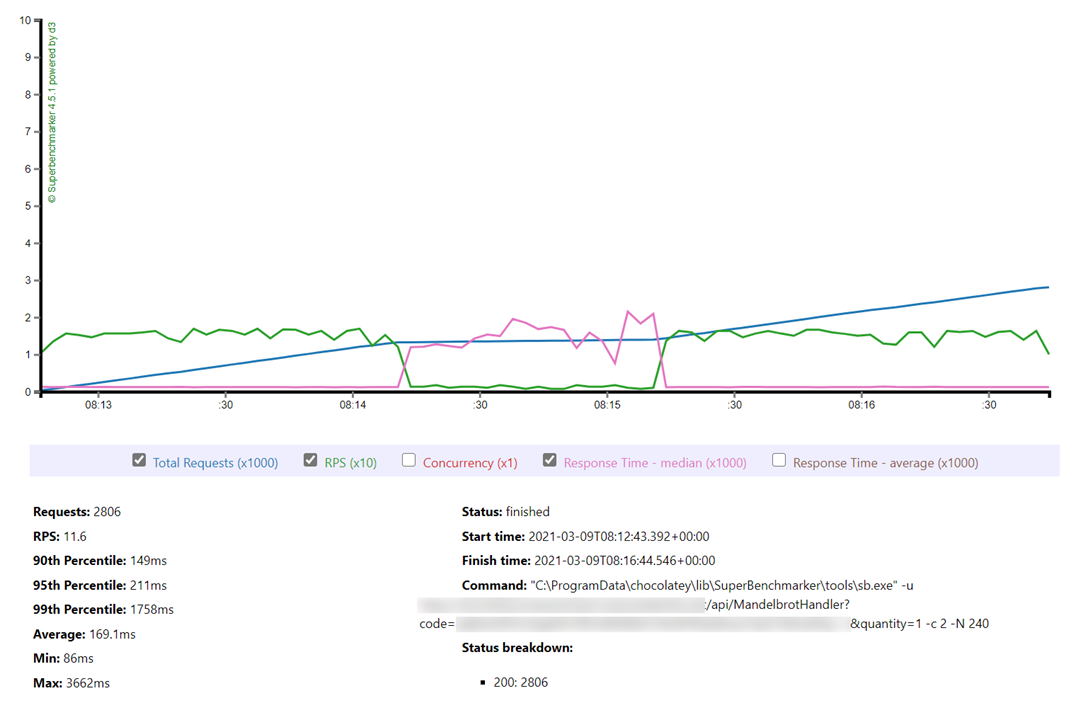
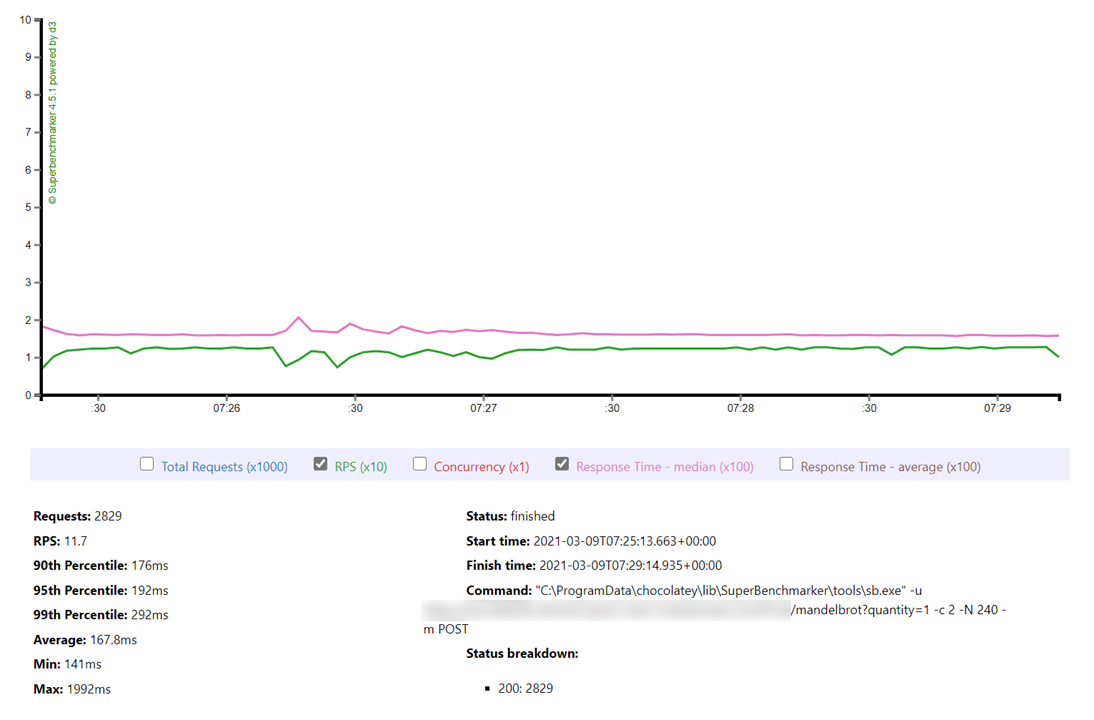
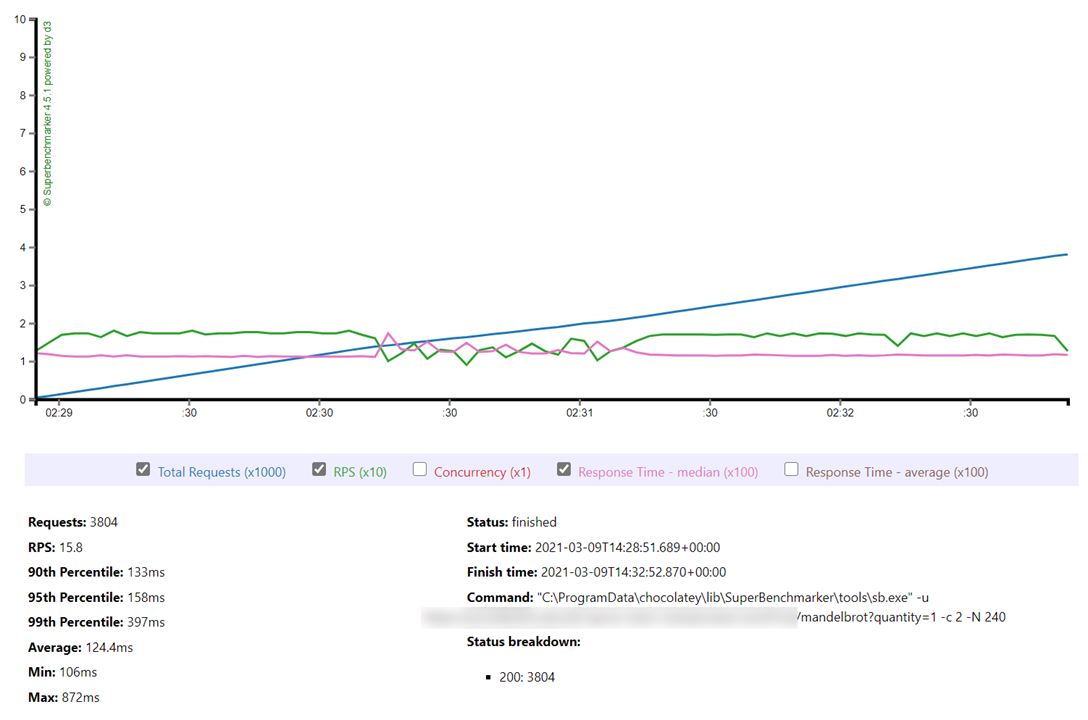
First up the 256Mb Lambda:
We can see here that the modest 1 Mandelbrot requests made to the Lambda are untroubled by the Spike. You can see a slight rise in response time and drop in RPS when the additional load hits but overall the Lambda maintains consistent performance. You can see what is happening in the spike below:
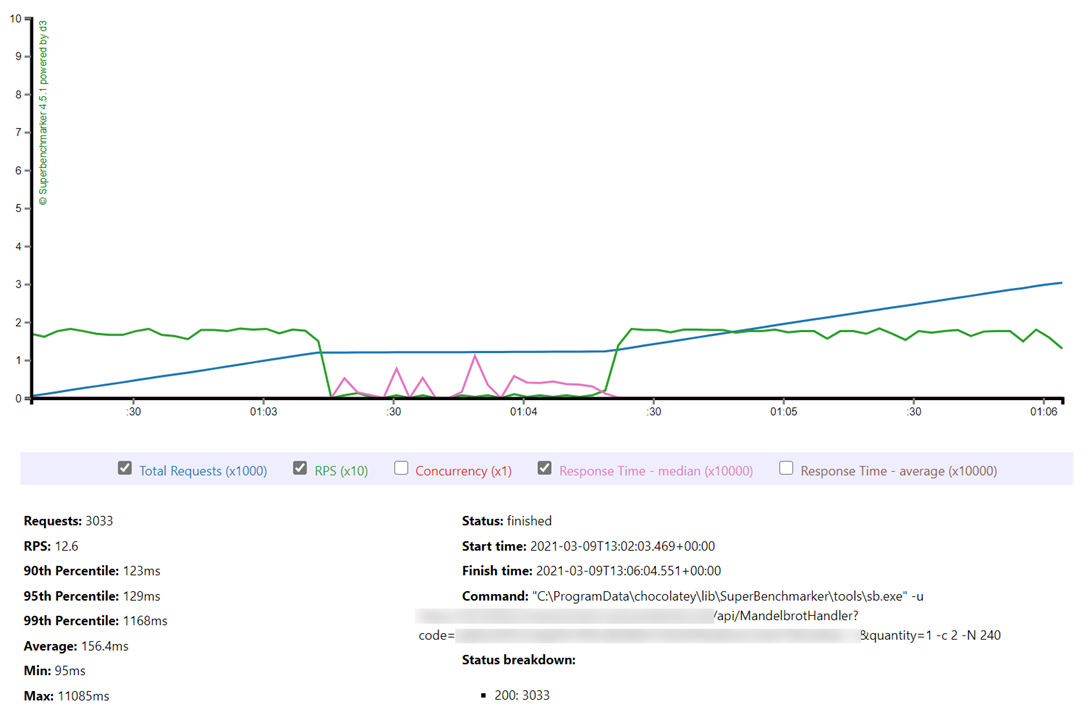
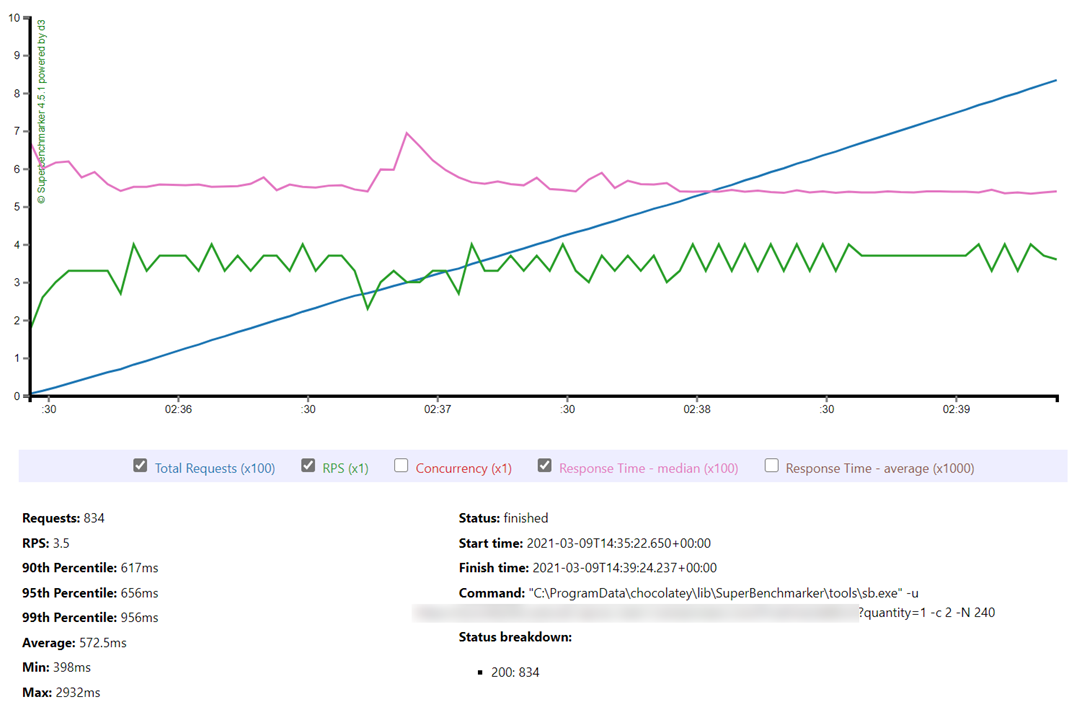
Like in our earlier tests the 256 Mb Lambda struggles with the request for 8 Mandelbrot’s - but its performance is isolated away from the smaller requests due to Lambda’s more isolated architecture. The additional spikes showed characteristics similar to the runs measured earlier. The 1024 Mb and 2048 Mb run are shown below:
Again they run at a predicable and consistent rate. The graphs for the spikes behaved in line with performance of their respective consistent loads.
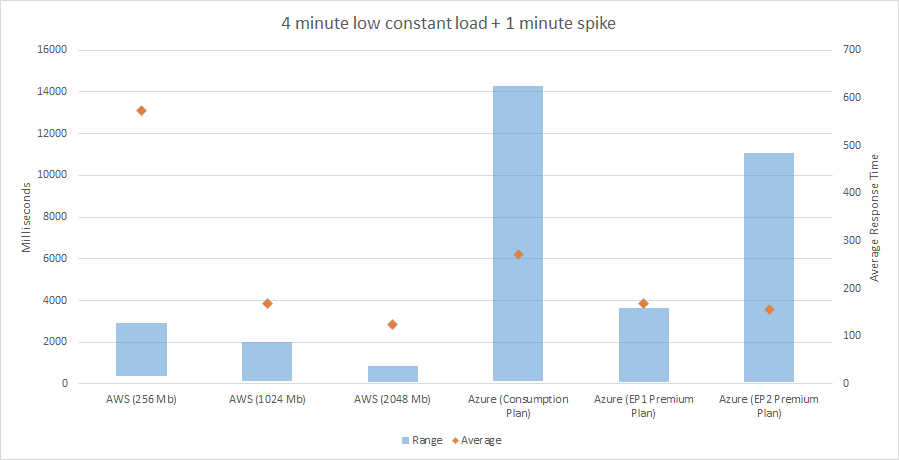
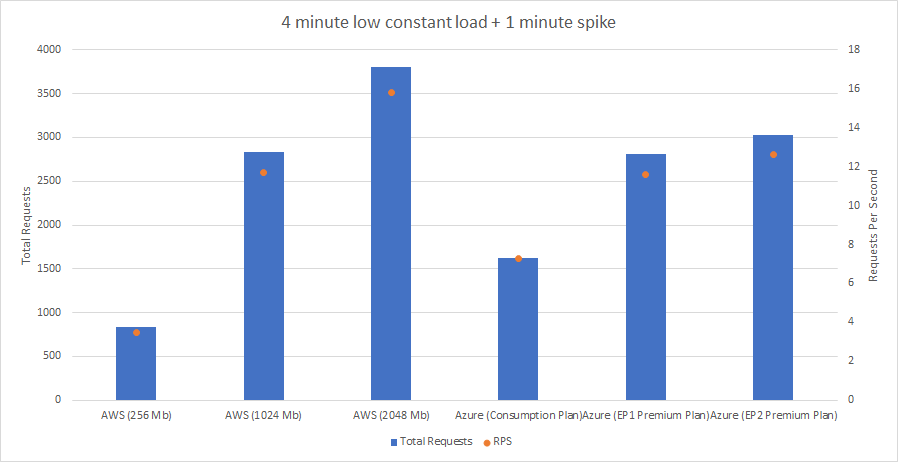
Spike Test Results Summary
Based on the above its unsurprising that the overall metrics are heavily in favour of AWS Lambda.
Concluding Thoughts
Its fascinating to see how the different architectures impact the scaling and performance characteristics of the service. With Lambda being based around containerized Functions then as long as the workload of a specific request fits within a containers capabilities performance remains fairly constant and consistent and any containers that are stretched have isolated impact.
As long as you measure, understand and plan for the resource requirements of your workloads Lambda can present a fairly consistent consumption based pricing scaling model.
Whereas Azure Functions uses the coarse App Service Instance scaling model - many functions are running within a single resource and this means that additional workload can stretch a resource beyond its capabilities and have an adverse effect on the whole system. Even spending more money has a limited impact for spikes - we would need resources that can manage the “peak peak” request workloads.
I’ve obviously only pushed these systems so far in these tests - enough to show the weaknesses in the Azure Functions compute architecture but not enough to really expose Lambda. That’s something to return to in a future installment.
In my view the Azure Functions infrastructure needs a major overall in order to be performance competitive. It has a FaaS programming model shackled to and held back by a traditional web server architecture. Though I am surprised by the EP1 results and will reach out to the Functions team.